
Web Analytics Dashboard, powered by Plausible for your Brand Portal. Each Brandkit account comes with a privacy first, GDPR compliant, Plausible.io powered web analytics dashboard, included out of the box.
Brandkit Platform Tour: Analytics
Brandkit includes Reports, Dashboards and Insights about your digital assets and content usage. Including web analytics for your Brand Portal and internal statistics and usage reports from the internal DAM.

Ficticious example of a Brandkit Usage Analytics Dashboard
Web Analytics Dashboard, powered by Plausible for your Brand Portal. Each Brandkit account comes with a privacy first, GDPR compliant, Plausible.io powered web analytics dashboard, included out of the box.

Content Analytics Dashboard, powered by Brandkit®. These analytics measure actual content usage in your Brandkit account including storage space used, asset counts, uploads, downloads and CDN traffic (Proxy images and embeds).
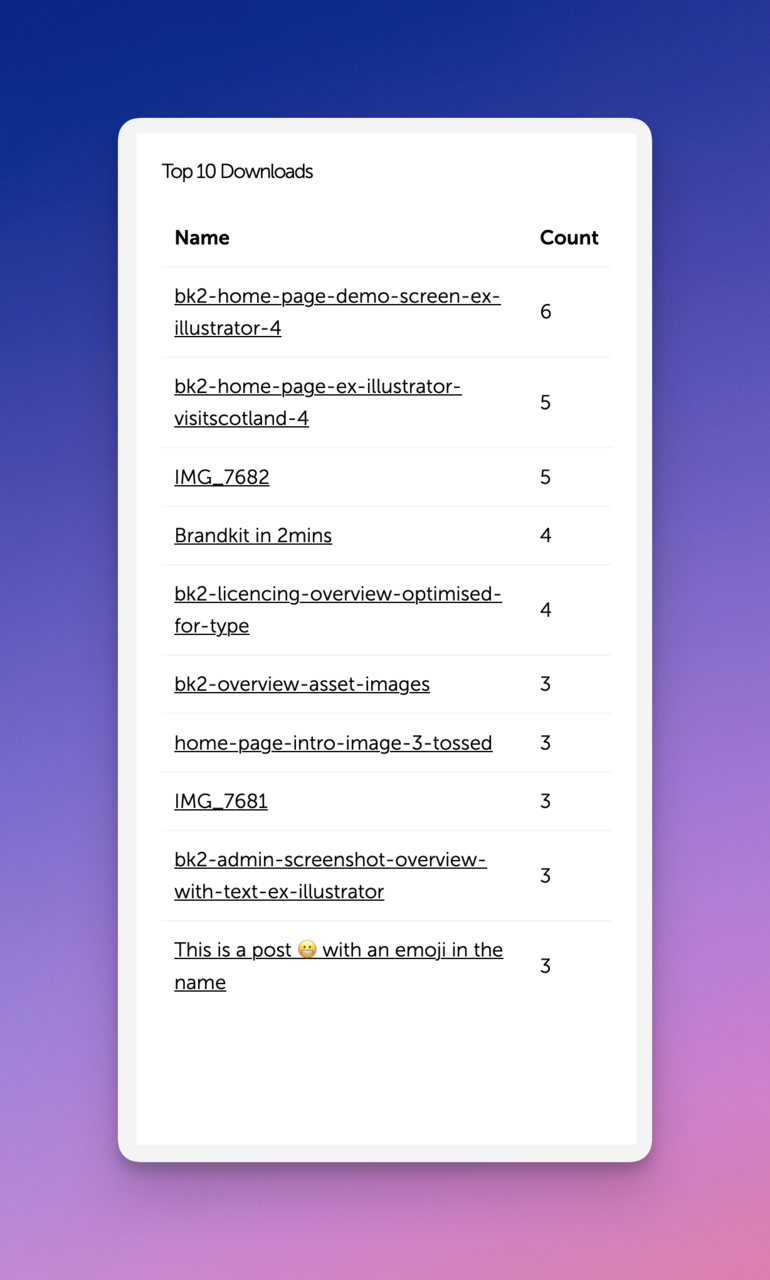
Top 10 Lists, powered by Brandkit®. These analytics show the most popular Assets, Traffic sources and Users.
And many more including: Usage summary and trends stack bar chart, Storage summary with asset-types by count breakdown pie-chart, Storage summary with asset-types by space occupied breakdown pie-chart, Traffic summary by asset type pie-chart, Users by User Role pie chart, Top 10 Downloded Assets, Top 10 Viewed Assets, Top CDN Traffic sources, Top 10 users by activity, Asset Activity (full downloadable report by Asset), Assets Metadata (full downloadable report by Asset), Users Activity (full downloadable report by User), Account Activity (a full audit trail of account activity per user), and per asset, etc.
B Authentic, Why Brandkit?, Read our blog, Frequently asked questions, Customer stories, Customer case studies, Common use cases, Our origin story, Our manifesto, Why DAM, Why NOT DAM, DAM Learning Centre, Is DAM the worlds most boring software?, What is a Brand Portal, What is a Brand Kit?, How to create a Brand Kit (a step by stepo guide), What is a Branding System?, The good brand checklist, Don't do junk content, Visit our Help Centre, Search Brandkit resources and digital assets, See our Brand Guidelines, Contact us.
GET STARTED TODAY
Trusted by brands since 1994 - Free trial available.